29.08
Share ArticleHow to recognise peaks and troughs on trading charts?

Becoming a winning trader, beating the financial markets and quickly increasing your capital is the dream of every beginning trader. However, achieving these dreams depends on acquiring key skills such as analysing charts, and more specifically, identifying peaks and troughs. After all, these points can indicate a change in trend and open up interesting trading opportunities.
Why is it important to recognise peaks and troughs?
Highs and lows are not just chart structure, they are data that can contribute to a trader's success in the financial markets. In particular, they can help you predict market trends, optimise entry and exit points, and better manage risk. A peak can indicate a reversal of a downtrend, signalling that demand may be beginning to weaken. Conversely, a trough may indicate an upward trend reversal, indicating that supply may begin to decline. By identifying these points, you will be able to anticipate market movements and make informed trading decisions.
How can you recognise peaks on a chart?
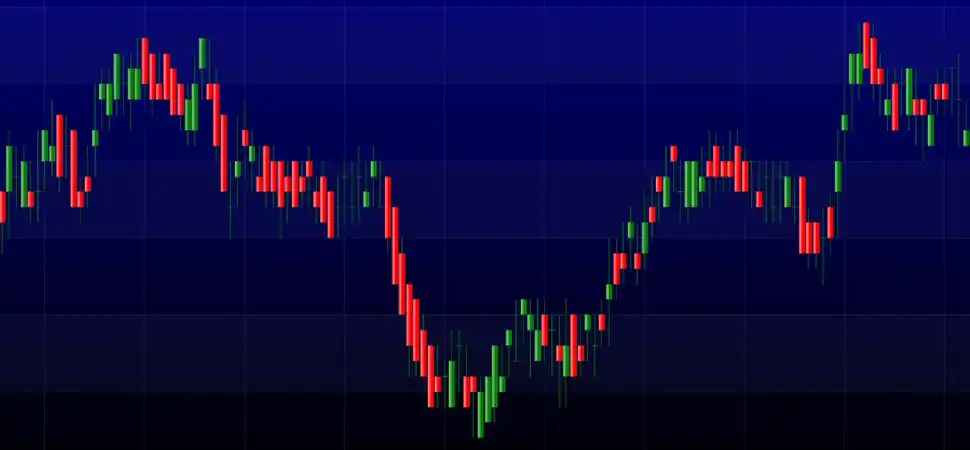
Identifying peaks on a trading chart can seem like a daunting task for beginning traders, but there are a few key points to look out for in order to recognise these structures more quickly. One such signal is a change in price direction: a top is formed when price reaches a high and then begins to decline. If you notice that the price reverses after a rise, it may indicate that the top has already been reached.
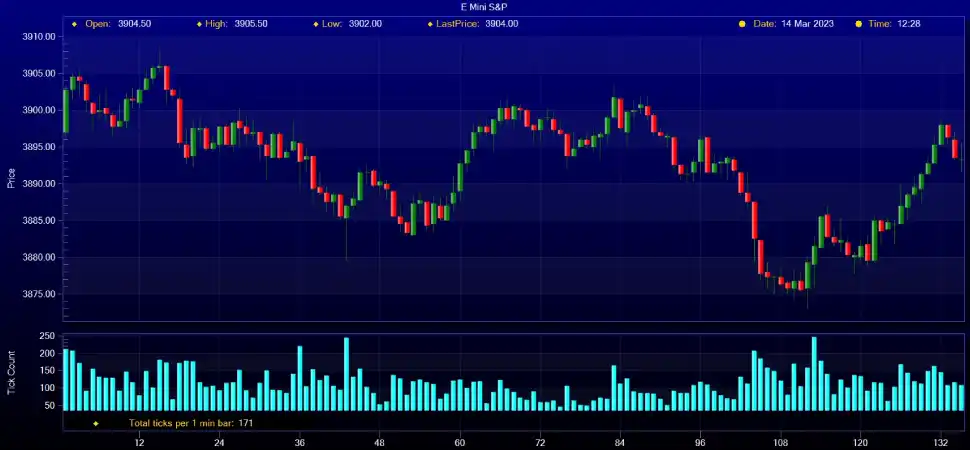
Another important factor is trading volume. Tops are often accompanied by an increase in volume, as many traders are looking to sell assets at that point. If you observe a price spike along with high trading volume, it could be a sign that the market has peaked.
It is also useful to use technical indicators to identify peaks. For example, the RSI (Relative Strength Index) can signal overbought conditions, which often occurs near tops. This indicator gives you a better sense of when the market is ready to reverse and helps you more accurately identify when price is likely to have peaked.

How can you recognise lows on a chart?
Understanding basic concepts such as candlesticks, trend lines, support and resistance levels plays a key role in identifying bottoms on a chart. A bottom usually forms when price reaches its lowest point and then begins to recover. This is when sellers begin to lose their positions and buyers come into play, changing the direction of the market.
It is useful to use technical indicators to identify lows. Tools such as RSI (Relative Strength Index) and MACD (Moving Averages) can help identify oversold conditions, which are often seen near market bottoms. However, it is worth remembering that no indicator can give an absolute guarantee, so it is better to use them in combination with other methods of analysis.
Patience and discipline are important qualities for a trader trying to identify a market bottom. Trading is a marathon, not a sprint. It is important not to rush into a buy just because the price has declined. Wait for confirmation that the bottom has indeed been reached, whether it is a change in price direction or a signal from a technical indicator. This approach will help you avoid mistakes and make more informed decisions.
How can you use this data to increase your trading activity?
Now that you have mastered the skills of detecting peaks and troughs, you can use this information to improve your trading strategy. It is important to understand that highs and lows reflect current market trends. For example, in an uptrend, each new peak will be higher than the previous peak and each trough will be higher than the previous trough, indicating buyer dominance. In the case of a downtrend, the situation will be the opposite: the highs and lows will gradually decline, indicating sellers' control.
Trend lines can be used to visualise these trends. These graphical tools help to connect successive peaks and troughs, showing the overall direction of the market. If the trend line is pointing down, it signals a downward trend and if it is pointing up, it signals an upward trend. However, be careful of false signals. The market is not always predictable and it may appear that the price has reached a new high or low when in fact it has not. For example, if trading volume does not increase when a new peak is reached, this may be a false signal and the price will soon return to previous values.
Don't forget to keep an eye on news that can significantly affect the market. Economic events, policy changes or important corporate announcements can cause sharp price fluctuations and lead to the formation of new highs and lows. For example, the Federal Reserve's decision on interest rates can trigger significant volatility and create new trading opportunities.
Conclusion
Recognising peaks and troughs on charts is not just a technical skill, but an important tool for building a successful trading strategy. The ability to analyse these points gives traders the ability to more accurately identify the moments to enter and exit trades, which significantly increases their chances of success. It is important to remember that the market can be unpredictable, and the key to successful trading lies in constant learning, discipline and the ability to adapt to new conditions.

.webp)
Reviews