22.08
Share ArticleMaster VWAP: Secrets of using the indicator for traders

Volume Weighted Average Price (VWAP) is an important indicator in the trading world that is used by traders to assess the overall price trend of a financial asset during a trading day. Unlike a simple average price, VWAP takes into account the volume of trades at each price level. This makes it particularly accurate and allows traders to gain a deeper understanding of market behaviour.
What is VWAP?
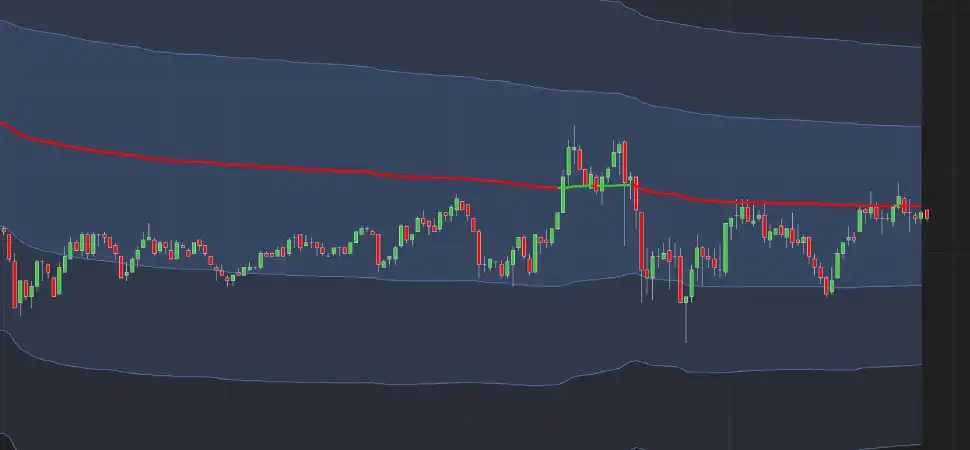
VWAP assigns different weights to prices based on the number of trades executed, making it more accurate for assessing market dynamics. On a chart, VWAP is represented as a line added to prices. It is calculated for a certain period, usually a trading day, and is reset at the beginning of each new period. This explains the sharp fluctuations of this indicator at the beginning of each trading session. The indicator is reset to reflect the new data for the current day.
One of the main uses of VWAP is its ability to determine the overall trend direction for the day. It quickly positions above or below current prices and offers a clear indication of the likely direction of the market. In the absence of a meaningful trend, VWAP remains relatively flat and closely monitors prices. In real time, however, VWAP lags behind prices. This lag increases as the day progresses, as its calculation takes into account all volume data since the opening of the session. Despite this lag, VWAP remains a valuable tool due to its ability to integrate both price and volume information.
How is VWAP calculated and interpreted?
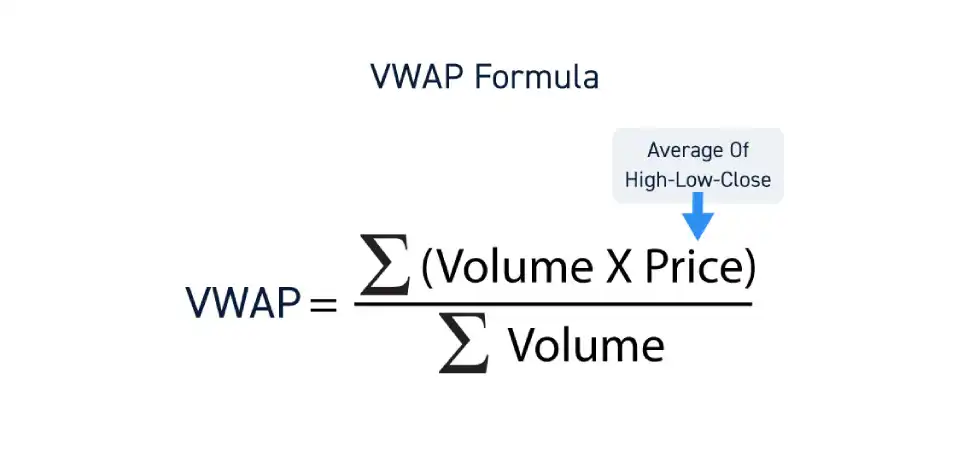
The VWAP indicator provides an estimate of the average price of an asset over a given period, taking into account the volume of trades associated with each price. VWAP is calculated using the following formula: VWAP = (Average price * Volume over time interval)/Cumulative volume. This formula reflects the concept of average price weighted by volume. This means that VWAP represents the average price of an asset as a function of trading volume. More precisely, VWAP gives more weight to prices at which a large volume of trades has been executed. This gives a more accurate representation of the market dynamics. The indicator is widely used by traders to determine the general trend of an asset for a certain period.

What is the difference between VWAP and moving average?
Although VWAP and moving average may appear to be similar price tracking indicators, their calculation methods and purposes differ significantly. One of the most significant differences lies in the way they are calculated. A simple moving average (SMA) is calculated by adding the closing prices of an asset over a certain number of periods and then dividing that sum by the number of periods.
For example, to calculate a 5 period moving average, the closing prices for five periods are added together and then divided by 5. The result is a value that reflects the average price movement over the time period. In contrast, VWAP takes into account not only prices, but also volume of deals. To calculate VWAP, multiply the average price by the volume of transactions for a given period and then divide this value by the aggregate volume. This volume-weighted approach allows VWAP to more accurately reflect the relationship between price and volume.
The main difference is how volume is accounted for. Moving averages do not take trading volume into account, whereas VWAP makes it central to its calculations. As a result, VWAP is particularly well suited to assessing short-term market dynamics, while moving averages are usually used to analyse long-term trends. The choice between these two indicators depends on your analysis objectives and the length of the period you want to focus on when trading or investing.
How to use the VWAP indicator?
The VWAP indicator can be used for a variety of purposes, including as a trend indicator to confirm the general direction of price movement for the current session. In fact, this indicator can play several roles in a day trader's strategy, as a potential support or resistance zone. It can also be used as a reference point for determining entry points or setting stop loss orders.
In practice, when the price of an asset remains below the VWAP line, it can be interpreted as a confirmation of the current downtrend. In other words, it indicates that prices are trending downwards. Conversely, when the price remains above the VWAP line, this can be interpreted as a sign of a bullish trend, indicating that prices are rising.
By using the VWAP in this way, traders can better understand price dynamics and identify potential support or resistance levels. They will also be able to identify strategic entry or exit points to maximise their profit opportunities while minimising risk. In short, VWAP is a versatile tool that can significantly improve the accuracy of trading decisions in volatile environments.
Conclusion
Using VWAP in trading opens up new opportunities for more accurate analysis and decision making in the market. It is important to remember that, like any other tool, VWAP requires careful attention and practice to maximise results. By using it in your trading strategy, you will be able to navigate market uncertainty with more confidence and successfully adapt to changing conditions.
Reviews