01.08
Share ArticleA complete guide to using Japanese candlesticks in trading

Studying Japanese candlesticks is one of the keys for traders looking to understand market dynamics and learn how to predict market movements. This method of analysing price charts is one of the most effective and popular technical analysis tools. Whether you trade stocks, currencies or commodities, the Japanese candlestick method can significantly improve your trading performance and help you make more informed decisions.
What are Japanese candlesticks?
Japanese candlesticks are a popular form of presenting stock price data. They were developed in Japan in the 18th century by Munehisa Homma, a famous rice merchant. Japanese candlesticks are a type of price chart that shows the open, close, high and low for a specific trading period. Japanese candlesticks are commonly used by traders to identify market trends and predict future price movements.
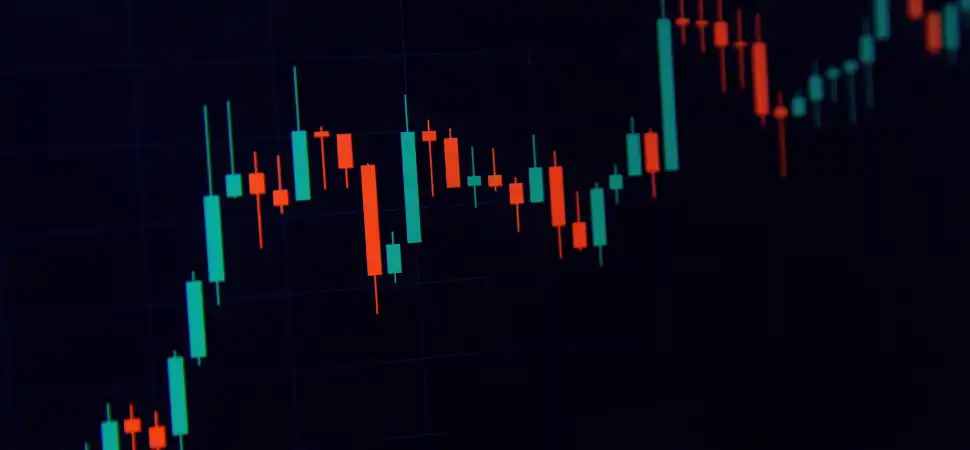
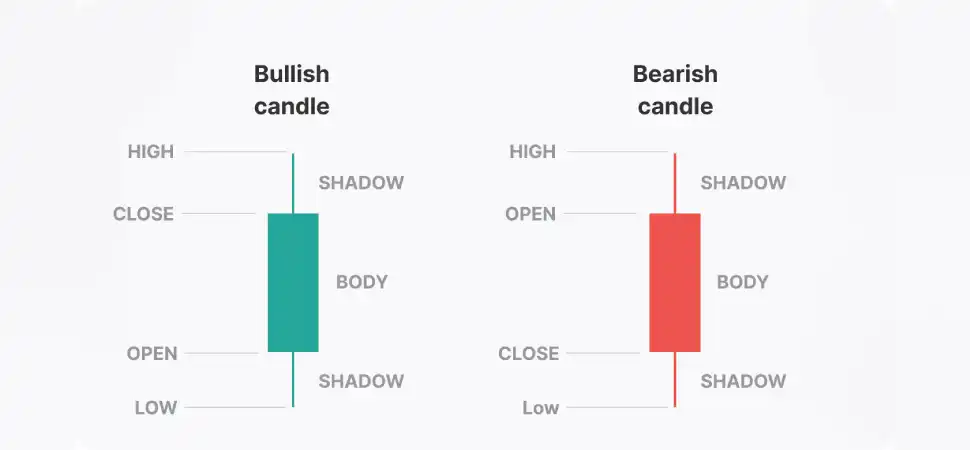
Candlestick charts communicate price information, including the open and close, as well as the highest and lowest values, through candlestick symbols. Each candlestick symbol represents generalised trading activity over a specific period of time (minute, hour, day, month, etc.) and is positioned on a timeline on the x-axis, representing price movement over time.
The main rectangle of the symbol is called the real body and is used to display the range between the open and close price for a certain period of time. The lines coming from the lower and upper parts of the real body are called the lower and upper shadows (or wicks). Each shadow represents the highest or lowest price for the time period represented. When the market is ‘bullish’ (the closing price is higher than the opening price), the body is usually white or green. When the market is ‘bearish’ (closing price below the opening price), the body is usually coloured black or red.
Fundamentals of Japanese candlestick trading
Trading using Japanese candlesticks is a popular method among traders because it helps to identify market trends and predict future price movements. Japanese candlesticks are candlestick shaped charts that show price movements in a given market. Japanese candlesticks can be used to analyse stock markets, currencies, commodities and cryptocurrencies. Japanese candlesticks are a useful tool for traders because they can provide important information about market trends. EU, for example, if closing prices are higher than opening prices, this can indicate an upward trend in the market. Conversely, if closing prices are lower than opening prices, it may indicate a downtrend in the market.
Japanese candlesticks can also be used to identify support and resistance levels in the market. Support levels are where prices stabilise after a fall and resistance levels are where prices stabilise after a rise. Japanese candlesticks can also be used to identify overbought and oversold levels in the markets. Overbought levels occur when asset prices are high relative to their real value, and oversold levels occur when asset prices are low relative to their real value.

How can Japanese candlesticks be used in trading?
Candlestick charts are used to identify and predict market trends over time and are useful for interpreting the daily market trend due to the colour and shape of each symbol. For example, the longer the body, the stronger the buying or selling pressure. On the other hand, a very short body indicates that the price has moved very little during the period and represents consolidation.
Candlestick charts help to reveal the psychology of the market (the fear and greed experienced by buyers and sellers) through various indicators such as shape and colour, as well as through the many identifiable patterns that can be found on candlestick charts. There are a total of 42 recognisable patterns which are divided into simple and complex patterns. These patterns found on candlestick charts are useful for displaying price relationships and can be used to predict possible future market movement.
Remember that candlestick charts do not show the events that occur between the opening and closing price, only the relationship between these two prices. Therefore, you have no way of knowing how volatile a trade was just for that period of time.
Pros and cons of trading on Japanese candlesticks
Trading using Japanese candlesticks has many advantages, but also a few disadvantages. The advantages include the simplicity of candlestick analysis, which allows you to easily identify trends, support and resistance levels. Japanese candlesticks also make it easier to detect trend reversals than other technical analysis tools.
The disadvantages of trading using Japanese candlesticks are mainly due to the fact that this method of analysis is relatively new and therefore requires some experience to use profitably. In addition, Japanese candlesticks are not always easy to interpret, which can lead to analytical errors. Japanese candlesticks reflect the movement of the price of an asset over a certain period, so they are a very useful tool for traders. They can be used to predict price trends, and traders can use these predictions to take winning positions.
Conclusion
Japanese candlesticks remain one of the most popular and effective technical analysis tools for traders in the financial markets. They provide clear and easy-to-understand information about market movements, helping traders to identify trends, support and resistance levels, and predict possible reversals.

.webp)
Reviews